Machine monitoring metrics transform raw measurements into meaningful insight.
The key is knowing which metric to use — and where.
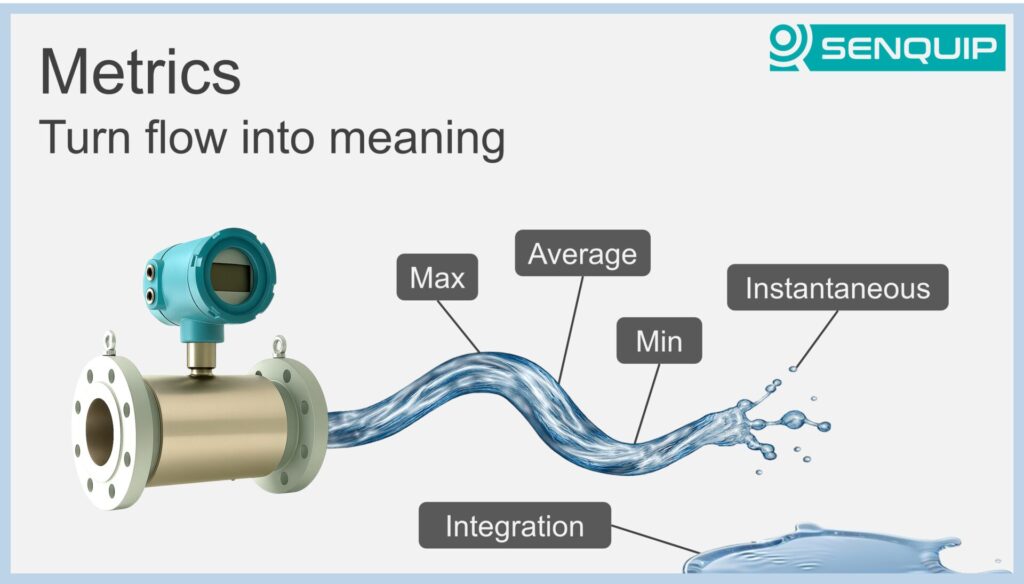
In the Senquip Vision Dashboard, different metrics help you interpret data from pumps, generators, and industrial equipment in practical ways:
📈 Latest – most recent value (e.g. current tank level)
🌡️ Min / Max – lowest or highest over a period (e.g. lowest level today)
⏱️ Time Weighted Average – ideal for slow-changing values like dam levels
💧 Integration – converts a rate (litres/sec) into a total (litres)
🌧️ Total – sums discrete events (e.g. rainfall or gate openings)
📊 Difference – compares values across periods (e.g. level change this week)
⚙️ Accumulation – continues increasing even if the source resets (e.g. hourmeter)
These metrics are calculated hourly and rolled up over your selected period, making it easy to compare daily, weekly, or monthly performance.
For remote monitoring systems, this turns raw data into actionable insight — helping you understand not just what is happening, but what is changing and why.